Holding and trading investment companies on platforms is much easier than it was, but costs still differ widely. Our new research reveals the full picture
We’re often asked by advisers which are the best platforms for holding investment companies. Clearly, ‘best’ may not mean ‘cheapest’, but looking at costs is a start. We thought it would be nice if we could give advisers and wealth managers an idea of how their choice of platform might affect the costs borne by their clients when investing in investment companies. The research, conducted by platform consultancy the lang cat, has now been published on the AIC website.
The platform world has changed rapidly in recent years and the good news is that now all major adviser platforms except two, Cofunds and Old Mutual, offer investment companies. Cofunds and Old Mutual both plan to offer investment companies in the near future, the former as a result of its acquisition by Aegon. Most platforms also make it possible to hold investment companies in model portfolios.
That said, the costs for holding and dealing in investment companies, either inside or outside models, vary a lot from one platform to another. To illustrate this, the lang cat has provided some of its trademark heatmaps, backed by painstaking research into the fine detail of the different platform charges.
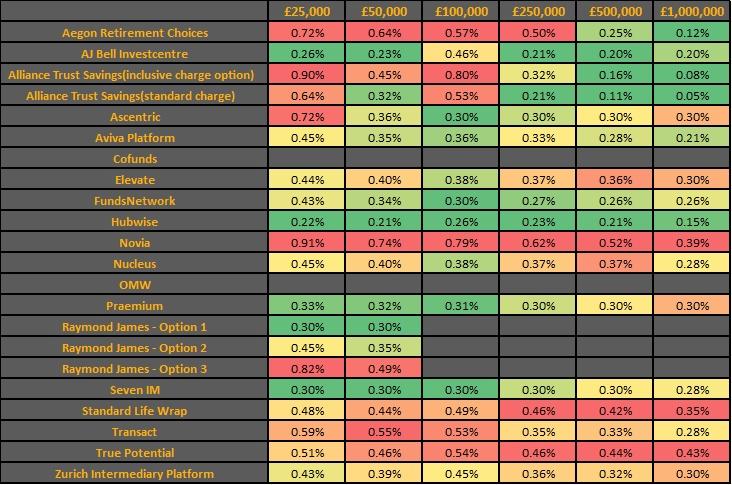
Here, for example, are the annual running costs in basis points for portfolios of different sizes invested 50/50 in open-ended funds and investment companies, with four transactions (buys or sells) a year (1). Detailed assumptions are in the footnotes to this article. Click the image to zoom in!
Annual platform costs for 50/50% portfolios of funds/investment companies. For assumptions, see footnotes. Source: AIC/the lang cat
As you can see, green is cheaper and red is more expensive. Platform costs for maintaining a £250,000 portfolio range from 21 basis points at AJ Bell or Alliance Trust Savings to 62 basis points at Novia. That’s a difference of more than £1,000 a year.
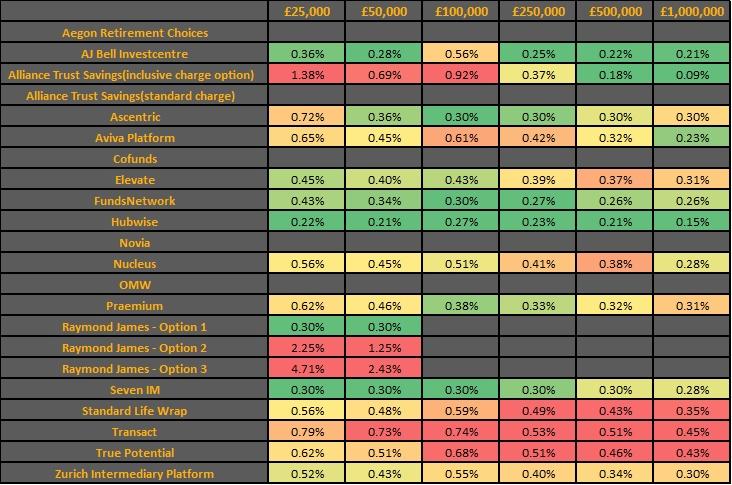
What about model portfolios? Here you will probably be paying transaction costs on rebalancing, as well as the standard custody charges. Again, the lang cat has made some common-sense assumptions (2), chiefly that the rebalancing is quarterly and the model portfolio has ten equally weighted holdings, comprising nine open-ended funds and one investment company.
Annual platform costs for model portfolios of nine open-ended funds and one investment company. Source: AIC/the lang cat
For a £250,000 portfolio in this scenario, the platform with the highest charges will cost the client more than double the cheapest. Costs range from 25 basis points with AJ Bell Investcentre or 27 basis points with FundsNetwork to 53 basis points with Transact.
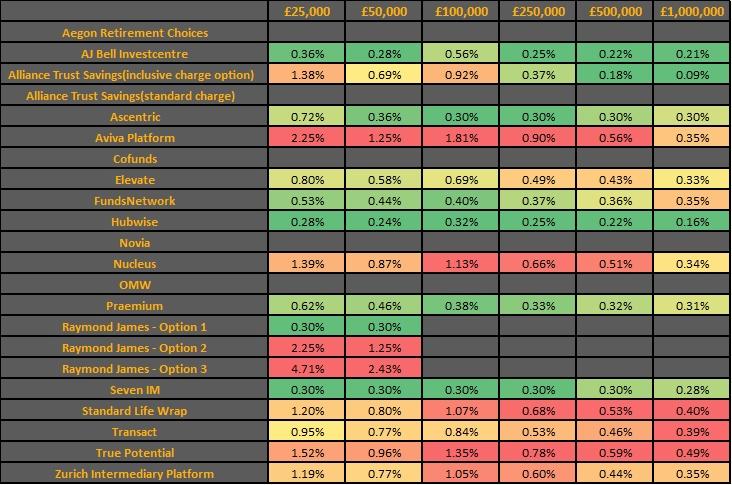
Changing the assumptions, not surprisingly, changes the result. If we shift to a model portfolio with a 50/50 split between open-ended funds and investment companies, with five of each, then the cheapest platform is still AJ Bell at 25 basis points but the most expensive is now Aviva Platform at 90 basis points.
Annual platform costs for model portfolios of five open-ended funds and five investment companies. Source: AIC/the lang cat
As we said right at the start, cost is only one consideration when choosing a platform, but it is an important one. We hope this research will help advisers save money for their clients while ensuring that they remain invested in the best and most suitable products – which may well include investment companies.
A longer version of this article, with additional tables, appears on the AIC's website.
1. The table looks at the cost of investing on platform for one year. Calculations include ongoing platform fees, any additional wrapper charges and trading where applicable. Where assets under administration (AUA) are £50,000 or less, it’s been assumed that the client is investing in an ISA. Above this level, a split of 25/25/50% in an ISA/general investment account/pension has been used. Raymond James does not have an on-platform pension, therefore it has not been included in the mixed wrapper calculations. The table assumes 50/50% investment in investment companies and funds, with ten equal holdings, making two transactions (buys or sells) of each investment type in the year. Data is based on publicly available charging structure information with some details verified via conversations with platforms in August 2017. 2. The notes above apply, except that the table assumes a model portfolio with ten equal holdings, where nine are funds and one is an investment company. Rebalancing is quarterly to correct a 2% drift. Data is based on publicly available charging structure information with some details verified via conversations with platforms in August 2017.